Agriculture
:quality(80))
A shortening of the net working capital cycle by two weeks in FY23, primarily driven by an improvement in DIO.
Our sample of Agriculture companies delivered a 13% increase in revenue during FY23 as many crop production volumes hit a record high. However, only 27% of the companies that increased revenue also achieved an uplift in margins, indicating the significance of the inflationary pressures that impacted fertiliser, fuel and feed costs during the year. Finance and labour costs also increased during FY23, reflecting rising interest rates and high competition for skilled workers, given low unemployment across the sector.
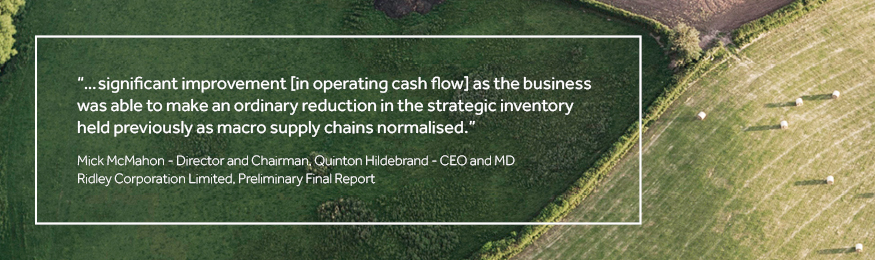
In terms of working capital performance, average DWC fell by 14.1 days to 136.6 days in FY23. Whilst this represented the largest improvement across all sectors covered, the sector remains the most working capital-intensive sector, with close to 60% of our sample carrying in excess of three months of working capital. The reduction in DWC was driven by lower inventory holdings, with average DIO falling by 27.2 days to 166.5 days in FY23. This reflected a release in the build up of inventory reported in FY22 as supply chains “normalised” and the level of agricultural exports increased. On average, our sample collected receipts from customers 5.5 days more quickly in FY23 (reducing DSO to 48.5 days). Approximately 64% of our sample reduced DSO, and most passed on the cash flow benefit to their suppliers through faster payments. On average, DPO decreased by 5.2 days to 65.1 days in FY23.
The large gap between the “best” and “worst” agricultural operators (> 400 days variance in DWC) highlights the complexities of managing working capital in this sector. Our Australian sample’s DWC remains significantly higher than our international sample, driven by higher DIO compared to the US and Asia, and lower DPO compared to our European sample. Looking forward, the Australian Bureau of Agricultural and Resource Economics and Sciences (ABARES) has forecast a 14% reduction in the value of Australian agricultural production in FY24, which is expected to be driven by shifting weather patterns to El Nino conditions and lower agricultural commodity prices.


Net working capital performance
Sector outlook
:quality(80))
:quality(80))
:quality(80))
:quality(80))
Financial Year
Days | 2022 | 2023 | Change |
|---|---|---|---|
DSO | 54.0 | 48.5 | (5.5) |
DIO | 193.7 | 166.5 | (27.2) |
DPO | 70.3 | 65.1 | (5.2) |
DWC | 150.7 | 136.6 | (14.1) |
Best & Worst
Days | Best | Worst | Spread |
|---|---|---|---|
DSO | 8.6 | 121.4 | 112.8 |
DIO | 34.0 | 381.9 | 347.9 |
DPO | 181.3 | 20.1 | (161.2) |
DWC | 20.1 | 426.6 | 406.5 |
International Benchmarking
Days | Asia | EU | US |
|---|---|---|---|
DSO | 68.8 | 65.5 | 35.7 |
DIO | 74.6 | 194.9 | 81.5 |
DPO | 40.9 | 140.8 | 31.3 |
DWC | 97.9 | 89.8 | 75.0 |
:quality(80))
:quality(80))
:quality(80))
:quality(80))
:quality(80))
:quality(80))
:quality(80))
:quality(80))