Food & Beverage
:quality(80))
Material reduction in DWC driven by lower average DSO and DIO, despite an offsetting decrease in DPO.
Our sample of Food & Beverage companies delivered average revenue growth of 9% in FY23, with 82% of operators reporting higher sales. Whilst some companies reported growth through product innovation and strong demand for products (such as dairy and olive oil), price increases were the main driver of higher revenue. The annual CPI for food and non-alcoholic beverages was 7.5% (12 months to June 2023), above the average CPI of 6% for all household expenditure. Annual price increases were highest for dairy, bread, and cereal products. However, only 36% of the sample was able to deliver both revenue and margin growth due to the combination of higher raw materials, utilities, freight and labour costs. The average gross margin fell by 5.5% across the sample.
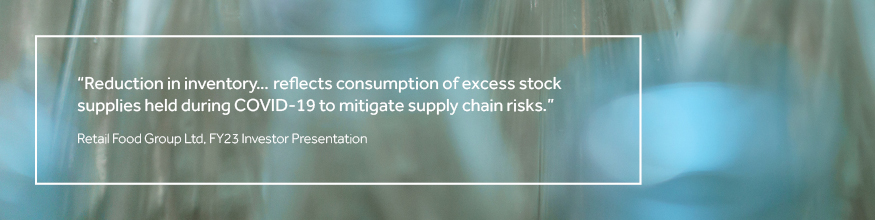
From a working capital perspective, average DWC for our sample decreased by 8.2 days (to 39.7 days) in FY23. Operators achieved a 7.6 day reduction in average DSO (to 32.3 days), however there was an offsetting shortening of supplier payment cycles with all of the companies that collected more quickly also paying their suppliers more quickly. Average DPO decreased by 15.3 days to 51 days in FY23. While these movements were important, inventory management remains key to working capital performance for Food & Beverage companies. Average DIO decreased by 22 days (to 56.3 days), representing the second largest reduction in inventory holdings of all sectors covered. The overall movement masked the fact that 45% of our sample experienced an uptick in DIO, highlighting the complexities of managing inventory in a sector where demand has been variable and participants need to manage a range of inputs. The biggest improvements were delivered by manufacturers and distributors of non-perishable products (including drinks and baby formula).
Our analysis of international metrics shows that the average DWC for our Australian sample was lower than their counterparts in Asia and Europe due to lower average DSO and DIO, however it was higher than the US sample, who pay their customers on longer terms. Looking forward, we expect that the rising cost of living and weaker consumer sentiment will put pressure on discretionary Food & Beverage providers. Uncertainty around demand will require an ongoing focus on strong sales, operations, and inventory planning.


Net working capital performance
Sector outlook
:quality(80))
:quality(80))
:quality(80))
:quality(80))
Financial Year
Days | 2022 | 2023 | Change |
|---|---|---|---|
DSO | 39.9 | 32.3 | (7.6) |
DIO | 78.3 | 56.3 | (22.0) |
DPO | 66.3 | 51.0 | (15.3) |
DWC | 47.9 | 39.7 | (8.2) |
Best & Worst
Days | Best | Worst | Spread |
|---|---|---|---|
DSO | 0.8 | 82.0 | 81.2 |
DIO | 4.5 | 118.6 | 114.1 |
DPO | 87.6 | 23.6 | (64.0) |
DWC | (19.3) | 110.7 | 130.0 |
International Benchmarking
Days | Asia | EU | US |
|---|---|---|---|
DSO | 38.7 | 50.6 | 30.9 |
DIO | 75.3 | 110.5 | 62.1 |
DPO | 59.9 | 94.1 | 78.7 |
DWC | 51.6 | 51.8 | 22.4 |
:quality(80))
:quality(80))
:quality(80))
:quality(80))
:quality(80))
:quality(80))
:quality(80))
:quality(80))